

Water impacts on everything we do, so the problems that mount from handling it poorly are many and varied. To help contextualise the importance of H20 to populous places, we bring you some of the choicest water facts and stats about its many uses and the challenges that accrue in our quest to manage urban water.
The Facts, Wart(er)s ‘n’ All
- The United States Geographical Survey estimates that just 2.5% of water on earth is fresh.
- About three quarters of that freshwater is trapped in ice. Every living being is largely vying for the rest.
- Snow and glacier meltwater does contribute to our potable supply. As the climate warms, this could provide new streams of freshwater but also a greater risk of flood.
- Access to safe, fresh drinking water – and the hygiene and sanitation that water provides – is a basic human right. As such, it’s one of the United Nations’ Sustainable Development Goals.
- As high as 90% of deaths caused by natural disasters relate to water causes.
- Between 1975 and 2001, 99% of these were suffered by low-income nations where it also caused losses to GDP of almost 14%.
- According to UN Environment’s Global Resources Outlook, “90 per cent of biodiversity loss and water stress are caused by resource extraction and processing”, which emits about 50% of all global greenhouse gas emissions.
- International water governance is problematic for urban spaces as water does not respect geopolitical boundaries.
- Jurisdictions are known to weaponise water where they have the power to control essential flow into another.
- In the Israel/Palestine conflict, one side is accused of limiting potable supply to the other who, for their part, allegedly polluted the former’s waterways.
- India threatened to cut off water running into Pakistan in 2019.
- In 2022, the Democratic People’s Republic of Korea opened the Hwanggang dam causing flooding in South Korea without warning.
The Role of Water in Cities
In addition to the obvious – quenching a thirst, washing, and swimming – humankind has utilised the power and properties of water for time immortal.
Transport & Trade
Prior to and during the Industrial Revolution, natural and hand-dug canals were the primary mode for transporting goods within and between cities.
- In Medieval ages, trade workshops (e.g. blacksmiths) sprung up alongside waterways, combining trade with connectivity.
- Cities such as Amsterdam and Bangkok developed quickly because of the economic boom created by water-based transport.
- Small-scale industries are once again returning to the canals, which offer close access to large urban markets.
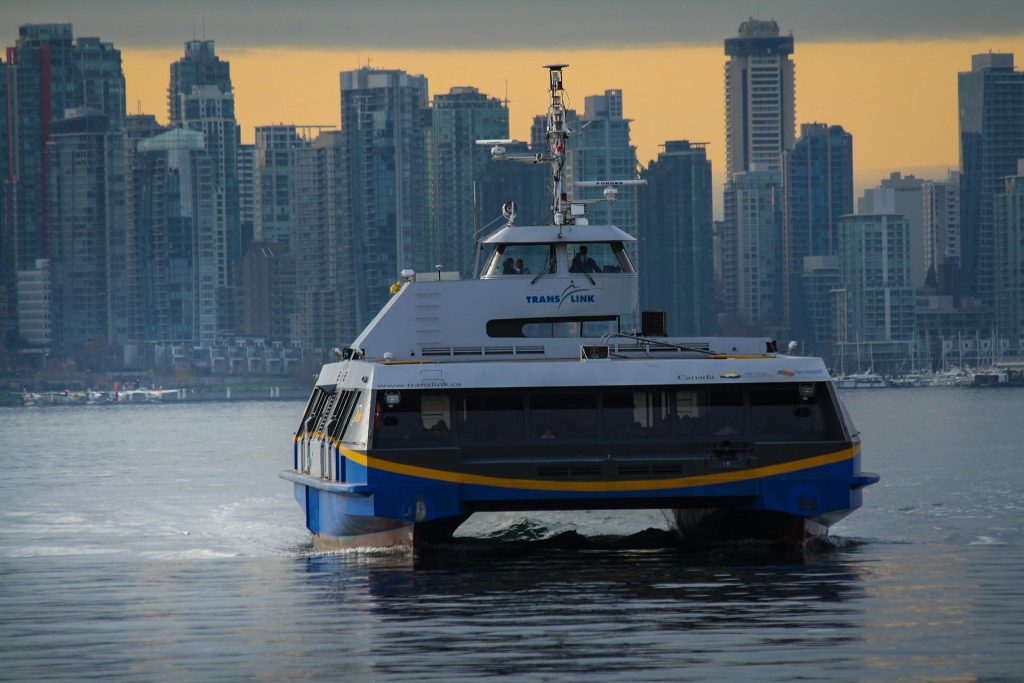
Modern cities have turned to waterways for transportation to ease congestions on roads.
- Examples like Vancouver’s Seabus is a quick, easily accessible bridge between the city’s shores – and it’s designed to carry people, bikes, and cars across.
Agriculture & Industry
As far back as 4,000 years ago, humans directed channels to supply water for irrigation, sustaining local populations.
These days, agriculture gobbles up 70% of all the freshwater we consume. A kilo of beef requires 15,000 litres, and it takes a full 1,000 kgs to grow a kilogram of wheat.
It is claimed that lab-grown meat could cut freshwater consumption out of production by up to 96%.
Even so, since Roman times cities have used greywater to flush sewer systems to rid our streets of the smells irradiating from public latrines (and, with it, bacteria and disease).
The modern industrial process is greedy for water. Typically, it takes…
- <40,000 litres to make a t-shirt and a pair of jeans.
- 12,760 litres to manufacture a smartphone.
- 1.39 litres for a one litre bottle of water!
- A whopping 234,695.5 litres to process a US ton of steel.
- 325 litres to produce just 1kg of paper.
Hydropower
Hydraulics have been used for centuries. Early waterwheels placed in flowing rivers moved mechanisms in various types of mills to produce grain and process wood, and in forges to provide high-pressure force and drive hammers and pumps.
The International Energy Agency claims that, since 2020, hydropower has become the largest representation of renewable electricity generation.
- It also states that hydropower is key to hitting 2030 net zero targets, but to achieve this, we need to scale up at a much faster rate.
Hydropower makes up 15.9% out of the total 27.3% share of global renewable energy production.
- That’s about 60% of the total of renewables.
- The next largest is wind power (5.9%). Solar lags behind, at 2.8%.
Norway, Greenland, and southern Africa have the largest share of their energy provided by water.
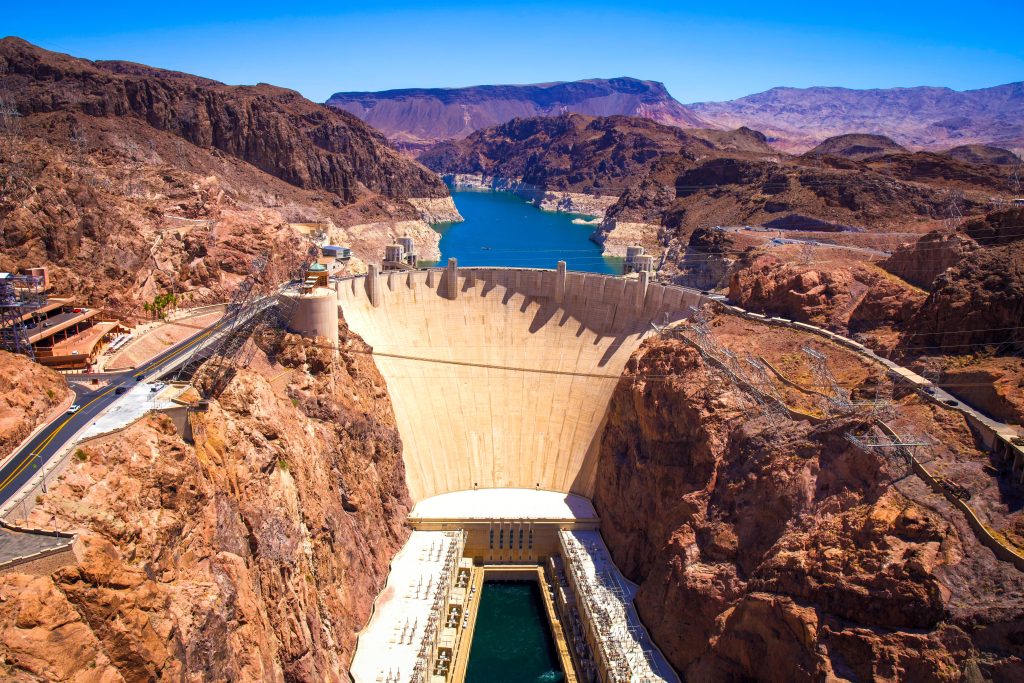
Artificial dams that create reservoirs for the generation of power also serve to control water flow downstream, for leisure activities, to supply clean water, and to service agriculture and industry.
Running Hot & Cold
In the USA, so writes the country’s Nuclear Regulatory Committee, water is the predominant coolant substance used in their nuclear power stations.
- Of all nuclear reactors worldwide, 96% are cooled by water.
The United States also uses a lot of water for domestic heating. According to 2009 figures, the share of all H20 used for heating in the country stood at 18%.
In an average US home, heating water accounts for just under 20% of the home’s electricity use.
Leisure Time
Water is the backdrop for many leisure and tourist activities, including water sports, hospitality, commerce, and nature retreats. The Lake Mead National Recreation Area close to Boulder, Colorado, for example, provided almost 170,000 jobs in 2018, generating an income of more than $1 billion USD. In the UK, water sports contribute £1.8 billion to the economy each year.
Swimming remains popular but surprisingly expensive: in the US, annual spending for a child to participate in a sport comes in at $693 USD but swimming tops that at $786.
Aside from income generation, the benefits of water sports include cooling, civic pride, restoring a connection between people and nature, and improved physical and mental health.
Water Stress
In the 100 years preceding 2021, demand for water increased by 600%.
“About 20% of the European territory and 30% of Europeans are affected by water stress during an average year,” reports the European Environment Agency.
The greatest stress on water sources comes from agriculture, which uses 59% of the total available in Europe (2017 figures) and roughly 70% of freshwater worldwide.
- Broken down, 24% of this originates from groundwater and 64% from rivers.
- Industry claims around 19% of all freshwater, and domestic use (including drinking) takes about 11%.
In 2016, 933 million people lived in cities facing stressed water supply. By 2050, this is likely to rise to more than 2.4 billion split across almost 300 cities and include at least 10 megacities.
“By 2030, 700 million people could be displaced because of intense water scarcity.” – Stockholm International Water Institute.
The world witnessed a rise in droughts by 29% from 2000-2020. (In the same period, there was a 134% increase in floods.)
A study of 71 cities with a population exceeding 750,000 summed up that 35% are “vulnerable to water shortages” and that 29% of megacities “would be vulnerable to water shortages by 2040 if no action is taken”.
Saturation Point – Flooding Facts
Of all natural hazard events since the mid-1990s, 43% were floods – making it the most common disaster.
- Between 1995 and 2015, flooding affected 2.3 billion people.
- According to the OECD, it impacts 250 million people a year and costs around $40 billion USD of damage.
- Since 1980, floods have caused more than a trillion US dollars’ worth of damage worldwide.
Coastal cities face a dual crisis because of the climate crisis: an increase in the threat of both floods and sea level rise.
- This puts approximately 40 million people in the danger zone for catastrophic 100-year coastal flooding events.
- African and Asian port cities appear to be most under threat.
- Compared to the early 2020s, the risk is predicted to rise nine-fold by 2050.
Clearing up after a deluge is time consuming and expensive. But many people don’t realise that they may need extra insurance specifically to protect against flooding.
- Only 12% of American homeowners are insured against floods despite the risk being 26%, compared with 9% for fires.
- In the USA, 20% of insurance claims for flooding are for land in low- to moderate-risk areas.
Health & Hygiene
Side effects of floods include waterborne disease, food shortages (through crop damage and disrupted supply chains), damage to natural habitats, the emergence of harmful bacteria or mould, and the silting of rivers, which chokes aquatic life.
According to the UN, as many as 2.1 billion people worldwide lack easy access to safe domestic water, and 4.5 billion have to cope without managed sanitation facilities.
- Globally, 3.6 billion people do not have a properly working toilet.
- Open defecation (in fields, streets, and waterways) is practiced by 673 million people because of a lack of suitable sanitation.
- Mumbai’s slums offer just six toilets per 8,000 women, often lacking water.
- This puts women and girls at greater risk of attack, especially at night.
- The absence of running water and sewer systems leaves settlements prone to transmission of diseases such as diarrhoea, cholera, dysentery, typhoid, intestinal worm infections, and polio.
- Poor water quality and sanitation kills more than 1.8 million people a year (including 700 children aged 5 or younger every day).
Provision of menstrual hygiene facilities is too often neglected by planners.
- A leading factor in more girls being likely to miss school than boys is the lack of adequate hygiene facilities, entrenching inequalities in education and life chances.
World Toilet Day – held on 19 November each year – aims to raise awareness and standards of sanitation.
- This makes economic sense, as, according to the UN, investing $1 in adequate sanitation systems generates “$5 in saved medical costs and increased productivity”.
- On that note, washing dishes by hand is wasteful: using a dishwasher instead can save up to 10 times as much water (and use much less energy to heat it).
Waste, Pollution & Contamination
Approximately 2.1 trillion gallons of potable H2O is lost in the US each year through leaking pipes.
- The UK wastes 23% of the public water supply this way, as does the EU.
- This figure reaches as high as 70% in low-income countries.
- Altogether, this equates to worldwide financial losses of $15 billion USD!
A lack of decent water management is largely to blame for the rate of freshwater being spoilt by pollution and waste, and opens chances for this to impact on human life and natural ecosystems.
As data from the UN’s AQUASTAT proves, people in low- and middle-income countries are most likely to be exposed to harm from dirty and untreated water. This can be attributed to the accelerated rate of economic and population growth.
It is thought that a minimum of 80% of wastewater remains untreated when released back to the environment, and, according to BOSAQ, many areas lack the legislation needed to ensure safe management of water supplies.
“In 2020, 45% of the household wastewater generated globally was discharged without safe treatment.” – World Health Organisation.
However, poor water quality is mostly caused by pollution from industries such as mining, manufacturing, chemical processing, and intensive agriculture.
- Industry dumps around 400 million tonnes of “heavy metals, solvents, toxic sludge and other waste into waters each year”.
- It’s estimated that 30% of contaminated urban wastewater in high-income nations goes untreated. The poor quality endangers health.
- In low-income regions, this rises to 92%!
But reusing and recycling water can be positive: “At least 10% of the world’s population is thought to consume food irrigated by wastewater,” claims the World Health organisation.
Further Reading…
If ever there was an argument for prioritising urban water management, surely it’s the knowledge that providing everyone with safe drinking water and infrastructure for decent standards of sanitation and hygiene can cut worldwide disease rates by 10%.
For more tantalising facts and to learn how water closely relates to food and energy – and how, combined, they drive the majority of socio-economic, health, and political forces within our cities – head to the Food-Water-Energy Nexus topic under the Research section of CityChangers.org.